
Summarising User Behaviour: Users Daily Table
Data Modeling for Google Analytics 4 and Firebase Analytics


It’s the third blog post of Modeling Google Analytics & Firebase Data. You can find the previous posts:
A healthy Data Warehouse (DWH) consists of a balanced combination of aggregated data models and raw event data. Aggregated models help in several ways:
Lower compute costs by reducing the volume of data processed.
Higher performance and faster queries due to the smaller dataset size.
Simplified querying with embedded business metrics and facts.
Consistent analysis by standardizing metrics and data cleaning.
Easy feature calculation for ML pipelines
Probably the most common data model in clickstream events is daily user aggregates regardless of business/industry since most of the dashboards are built on daily granularity. I like naming tables by the primary keys since it makes it more semantic. So I’ll call this table `users_daily`.
This table will contain 1 row for each active user on a specific day. At the end, it will include all the user metrics and attributes to help us understand the business. It’s very easy to create dashboards on top of this dashboard, so you’ll love it.
In the previous article we created an `events.events` table, so `users_daily` will be built on top of this table. Let’s start by having the most simple metrics of Google Analytics Sample Gaming Project.
The starter template is:
SELECT
    user_pseudo_id,
    dt,
    --- attributes
    --- metrics
FROM events.events
WHERE -- data cleaning
GROUP BY 1,2
In this query, you can use user_pseudo_id instead of user_id, but the main idea is we should never add any other columns to the group by. This way, we’ll ensure the primary key (PK) is consistent.
Where
This table contains only user activity data. So I recommend excluding the data not relevant to user activity. For example, Firebase triggers app_remove, os_update, app_clear_data, app_update and app_exception events even the app is not open.
Also, if a row doesn’t have a user_id, it doesn’t make sense to aggregate them either. Let’s exclude them, too.
So now, our query looks like:
SELECT
    user_id,
    dt,
    --- attributes
    --- metrics
FROM events.events
WHERE
    user_id is not null
    and event_name not in ("app_remove", "os_update", "app_clear_data", "app_update", "app_exception")
GROUP BY 1,2
Metrics
Metrics are the aggregates that shows what users did within the day. The simplest way to obtain the main metrics is to count the main events.
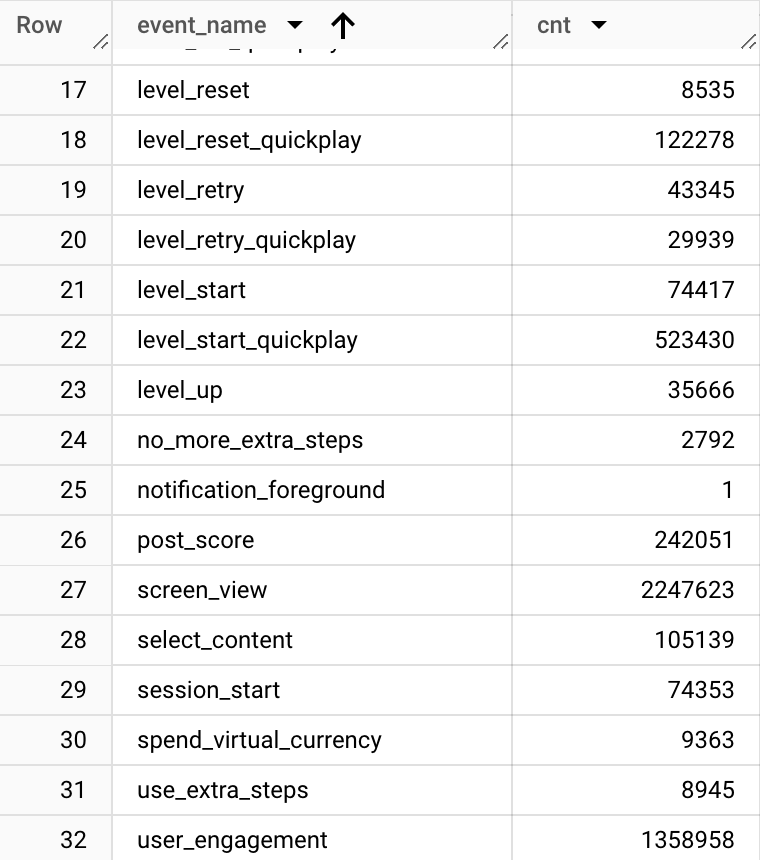
When I query the table, I see the events as metric candidates:
SELECT event_name, count(*) as cnt
FROM `bruin-blog-firebase-demo.events.events_json`
WHERE event_name not in ("app_remove", "os_update", "app_clear_data", "app_update", "app_exception")
group by 1
SELECT
    user_id,
    dt,
    --- attributes
    --- metrics
    count(*) as event_cnt,

    -- app monetization metrics
    countif(event_name="ad_reward") as ad_reward_cnt,
    countif(event_name="in_app_purchase") as iap_cnt,

    -- app engagement metrics
    countif(event_name = "level_start") as level_start_cnt,
    countif(event_name = "level_end") as level_end_cnt,
    countif(event_name = "level_complete") as level_complete_cnt,
    countif(event_name = "level_fail") as level_fail_cnt,
    countif(event_name = "level_retry") as level_retry_cnt,
    countif(event_name = "level_start_quickplay") as level_start_quickplay_cnt,
    countif(event_name = "level_end_quickplay") as level_end_quickplay_cnt,
    countif(event_name = "level_complete_quickplay") as level_complete_quickplay_cnt,
    countif(event_name = "level_fail_quickplay") as level_fail_quickplay_cnt,
    countif(event_name = "level_retry_quickplay") as level_retry_quickplay_cnt,
    countif(event_name = "level_up") as level_up_cnt,
    countif(event_name = "challenge_a_friend") as challenge_a_friend_cnt,
    countif(event_name = "challenge_accepted") as challenge_accepted_cnt,
    countif(event_name = "no_more_extra_steps") as no_more_extra_steps_cnt,
    countif(event_name = "use_extra_steps") as use_extra_steps_cnt,
    countif(event_name = "select_content") as select_content_cnt,

FROM events.events
WHERE
    user_id is not null
    and event_name not in ("app_remove", "os_update", "app_clear_data", "app_update", "app_exception")
GROUP BY 1,2
As you can see, I tried to add all the relevant events to the summary table. This will help us to monitor the user behavior in the dashboards very quickly.
In the second iteration of the metrics, we will use parameters. This process requires a good understanding the events and their parameters. For example:
level events have these parameters:
SELECT event_name, ep as event_params
FROM `bruin-blog-firebase-demo.events.events_json`
WHERE event_name like "level%"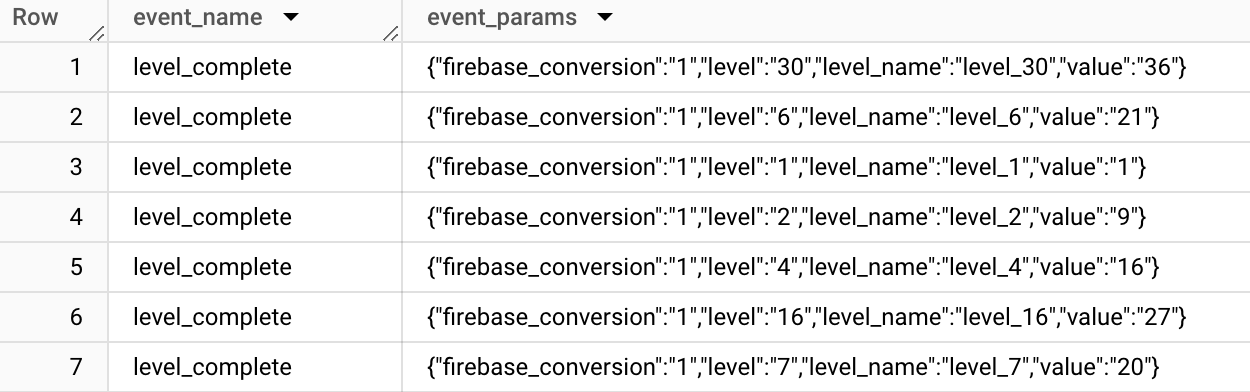
By using these events, we can obtain the min&max level played on that day. To do it, we can just add these to the query:
SELECT
    user_id,
    dt,

    min(level) as min_level,
    max(level) as max_level,

FROM events.events
WHERE ...
GROUP BY 1,2
Here, you should be very careful that the level parameter is not used in other levels in another context. If it’s used, you can filter your query for specific metrics:
    min(if(event_name like 'level_%', level, null)) as min_level,
    max(if(event_name like 'level_%', level, null)) as max_level,
    min(if(event_name = 'level_complete', level, null)) as min_level_completed,
    max(if(event_name = 'level_complete', level, null)) as max_level_completed,
Let’s inspect the in_app_purchase event to add the revenue to our table:
SELECT event_name, event_params, event_value_in_usd
FROM `bruin-blog-firebase-demo.events.events_json`
WHERE event_name = "in_app_purchase"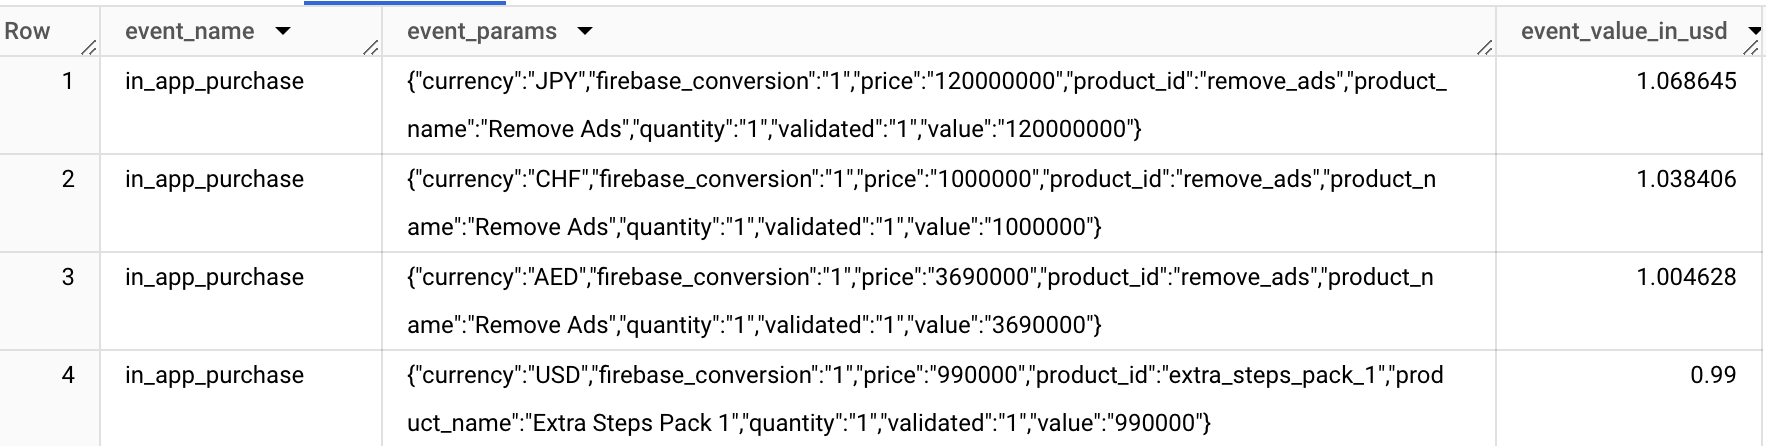
As you can see, there are currency and price parameters. However, since they have different currencies, using it is impossible. To solve this problem, Google Analytics provides the `event_value_in_usd` field. Let’s add it to our metrics as well:
sum(if(event_name="in_app_purchase", event_value_in_usd, 0)) as iap_revenueAfter that point, I recommend learning the product very well, deciding on the metrics with product managers, and adding all of them to the users_daily table. The only exception is, for calculated metrics, I recommend you to do it on the BI layer.
For example, if you want to calculate win_rate, it’s better to add level_start_cnt and level_complete_cnt to this table. By using level_complete_cnt / level_start_cnt, you can easily calculate the win rate.
Attributes
Attributes are non-aggregatable information that provides additional details about the user, such as the user’s device brand, country, OS version, and platform. To summarize these attributes, I recommend using two different methods based on their types:
Dynamic Values
Static Values
Let’s start with the country attribute. A user can use your app in more than one country during a single day. For such dynamic values, it makes sense to capture the first and last values of the day. Country, os_version, app_version are examples of this group.
To get them, you can use min_by and max_by functions.
SELECT
    user_id,
    dt,

    MIN_BY(country, ts) as first_country,
    MAX_BY(country, ts) as last_country,

FROM events.events
WHERE ...
GROUP BY 1,2
Some of the values don’t change for a specific user id. For example, user_pseudo_id is assigned right after installing the app. If you are using user_pseudo_id as the primary key, we expect device platform, brand, device model values to be stationary. For that kind of attributes, we can use any_value since it doesn’t change for a user.
SELECT
    user_pseudo_id,
    dt,

    ANY_VALUE(platform) as platform,
    ANY_VALUE(device_brand) as device_brand,
    ANY_VALUE(device_model) as device_model,

FROM events.events
WHERE ...
GROUP BY 1,2
If you are controlling your user ids from a backend system, I don’t recommend using ANY_VALUE, but FIRST/LAST since all the attributes become dynamic.
Lastly, I want to mention user behaviour attributes. They show user behaviour like metrics, but still they’re mostly strings, so summing, counting doesn’t make sense on them.
One example is screen or event_name. If you want to measure where the users leave your app, you might want to calculate the first/last screen and events.
SELECT
    user_pseudo_id,
    dt,

    MIN_BY(event_name, ts) as first_event,
    MAX_BY(event_name, ts) as last_event,
    MIN_BY(screen, ts) as first_screen,
    MAX_BY(screen, ts) as last_screen,

FROM events.events
WHERE ...
GROUP BY 1,2
When we bring everything together, you’ll have a query like:
SELECT
    user_id,
    dt,

    MIN_BY(country, ts) as first_country,
    MAX_BY(country, ts) as last_country,
    MIN_BY(device_brand, ts) as first_device_brand,
    MAX_BY(device_brand, ts) as last_device_brand,
    MIN_BY(os_version, ts) as first_os_version,
    MAX_BY(os_version, ts) as last_os_version,
    MIN_BY(device_language, ts) as first_device_language,
    MAX_BY(device_language, ts) as last_device_language,

    count(*) as event_cnt,
    min(ts) as min_ts,
    max(ts) as max_ts,

    MIN_BY(event_name, ts) as first_event,
    MAX_BY(event_name, ts) as last_event,
    MIN_BY(screen, ts) as first_screen,
    MAX_BY(screen, ts) as last_screen,

    min(level) as min_level,
    max(level) as max_level,
    count(distinct timestamp_trunc(ts, minute)) as session_duration,

    -- app monetization metrics
    countif(event_name="ad_reward") as ad_reward_cnt,
    countif(event_name="in_app_purchase") as iap_cnt,
    sum(if(event_name="in_app_purchase", event_value_in_usd, 0)) as iap_revenue,

    -- app engagement metrics
    countif(event_name = "level_start") as level_start_cnt,
    countif(event_name = "level_end") as level_end_cnt,
    countif(event_name = "level_complete") as level_complete_cnt,
    countif(event_name = "level_fail") as level_fail_cnt,
    countif(event_name = "level_retry") as level_retry_cnt,
    countif(event_name = "level_start_quickplay") as level_start_quickplay_cnt,
    countif(event_name = "level_end_quickplay") as level_end_quickplay_cnt,
    countif(event_name = "level_complete_quickplay") as level_complete_quickplay_cnt,
    countif(event_name = "level_fail_quickplay") as level_fail_quickplay_cnt,
    countif(event_name = "level_retry_quickplay") as level_retry_quickplay_cnt,
    countif(event_name = "level_up") as level_up_cnt,
    countif(event_name = "challenge_a_friend") as challenge_a_friend_cnt,
    countif(event_name = "challenge_accepted") as challenge_accepted_cnt,
    countif(event_name = "no_more_extra_steps") as no_more_extra_steps_cnt,
    countif(event_name = "use_extra_steps") as use_extra_steps_cnt,
    countif(event_name = "select_content") as select_content_cnt,

FROM events.events
WHERE
    user_id is not null
    and event_name not in ("app_remove", "os_update", "app_clear_data", "app_update", "app_exception")
GROUP BY 1,2
Running on Production
Since the previous days’ data never changes, I recommend using an incremental flow for this table. You can find the full version of this pipeline here.
Also, you can use `bruin init firebase` in your terminal to bring all Firebase Analytics pipeline to your computer.
If you have questions about this article or running Bruin pipelines, don’t forget to join our Slack community.
If you need help to run your data pipelines, visit Bruin website. Bruin is an end-to-end data product platform that empowers your data analysts/scientists by 10x!